From: Doug Casey's Take <dougcasey@substack.com>
Date: Tue, Aug 26, 2025, 3:50 PM
Subject: Socialist Economics 101
To: <esquire777@gmail.com>
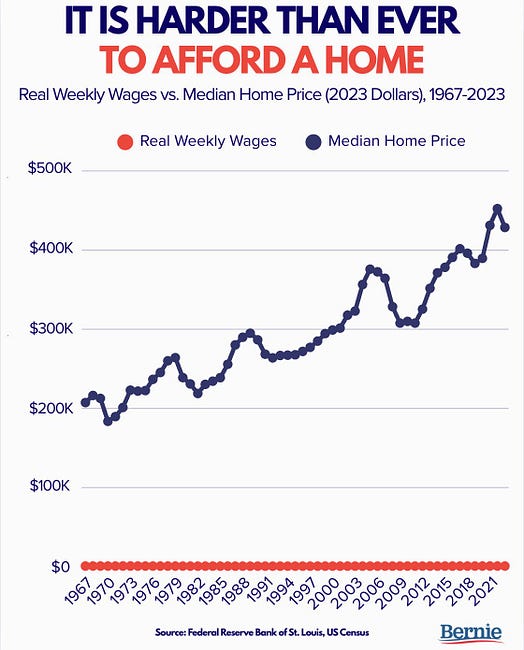
If you needed proof that socialists don't understand economics, look no further than this tweet from Bernie Sanders. Classic Bernie. Blame billionaires, demand more government spending, rinse and repeat. It's the same tired playbook he's been running for decades. The housing crisis isn't caused by insufficient government "investment"—it's the direct result of government interference. Washington pours billions into HUD, where money disappears into bureaucratic black holes while zoning laws strangle supply. Want affordable housing? Stop subsidizing it. Subsidies drive prices higher, not lower. Instead, slash the red tape, reform zoning laws, and let builders actually build. Oh, and stop printing money to inflate away everyone's purchasing power—but I'm not holding my breath on that one. But here's where Bernie really outdoes himself. Check out the chart he posted to support his argument: Now, Bernie is trying to highlight a real problem. Housing affordability is crushing middle-class families across America. It's a legitimate crisis that deserves serious analysis. Too bad he can't do serious analysis to save his political career. This chart is an absolute disaster. Let me count the ways it's wrong. First, he's comparing weekly wages to annual home prices. Weekly to annual. On the same chart. It's like comparing your lunch money to the GDP of France and wondering why the numbers look weird. The visual effect makes it appear that Americans earn essentially nothing while home prices soar into the stratosphere. Second, even if we fixed the time period mismatch, using individual wages is fundamentally misleading. Houses aren't bought by solo twenty-somethings living in their parents' basements. They're purchased by households—typically dual-income families who've been the economic norm since the 1970s. Every mortgage calculator, every affordability metric, every lending standard is based on household income, not individual wages. Frankly, he should fire whoever put this chart together—assuming they were hired in the first place. Socialists do have a soft spot for free labor from unpaid interns, after all. So what would the actual story look like with proper data? I've gone ahead and created a corrected chart for you below. When we compare apples to apples—median home prices to median household income, both annualized—we get a much more nuanced picture. Housing has indeed become less affordable, with the price-to-income ratio climbing from roughly 3.5 in 1984 to about 5.3 today. In other words, the typical American family now has to work much harder to afford the same home. But notice something crucial: the steepest increases coincide precisely with periods of massive government intervention. The post-dot-com bubble recovery fueled by Fed easy money after 2001. The housing bubble inflated by government-backed mortgages and Fannie Mae shenanigans. The recent explosion driven by unprecedented monetary stimulus and COVID lockdown policies. Every time Washington rides to the "rescue," housing becomes less affordable for ordinary Americans. Every. Single. Time. Yet Bernie's solution is more of the same poison that created the problem. More spending. More subsidies. More government "investment." And more wealth redistribution (that discourages the very investment needed to increase housing supply). Regards, Lau Vegys Doug Casey's Crisis Investing is a reader-supported publication. To receive new posts and support our work, consider becoming a free or paid subscriber. You're currently a free subscriber to Doug Casey's Take. © 2025 Doug Casey & Matthew Smith |


No comments:
Post a Comment